Monday, December 31, 2018

My Top 2018 Blog Entries

The end of a year seems like an appropriate time to look back and reflect on the year that has passed. Much like 2017, 2018 was another crazy year in the world of politics and public policy. There was everything from the Brazilian presidential elections and Brexit politics to the Brett Kavanaugh hearings and the Democrats regaining the House. In terms of my blog, I want to end the year with some of the 2018 highlights from my blog entries.

  1. Trump and Immigration. Trump took multiple attacks on immigration this year, including his views on chain migration, his unprecedented family separation policy, and his expressed desire to remove birthright citizenship. With the United States ending the year with the partial government shutdown surrounding the border wall (which is a bad idea to begin with) and Trump turning his back on asylum seekers, it doesn't look like immigrants are going to have a good year in 2019.
  2. Trump and Tariffs. International trade is another topic about which Trump has expressed woeful ignorance this year. He started off the year with tariffs on solar panels, proceeded with tariffs on steel and aluminum, and decided to escalate to an all-out trade war with China. Comedian John Oliver understands the price of this stupidity, and covered it quite well this past July.
  3. Trump and NAFTA. Trump had a campaign promise of overhauling NAFTA. I'm sure he'll make a bigger deal out of it than it actually is. Rather than a major overhaul, it was only a tweaking that made it slightly worse. Given how protectionist Trump is, I felt that it was the least worst scenario.
  4. Having Children Can Be As Selfish As Not Having Children. This blog entry is not related to public policy, but it was one of my more controversial pieces of the year. The title speaks for itself.
  5. International Economy. A lot of economies have made the news in terms of having problems, including Argentina, Greece, Italy, and Turkey. If the global markets are as crazy as this past year (or even crazier), the global economy is going to be on quite the roller coaster for 2019. 
  6. Causes of Wage Growth Stagnation. An economic question on many minds this year is why has wage growth been stagnant. I come up with a list of 10 possible explanations, ranging from retiring Baby Boomers and automation to unions and monopolies. 

Happy New Year!

Thursday, December 27, 2018

Should the Fed Keep on Raising the Interest Rate?: A Look After the December 2018 Increase

President Trump has used Twitter as a platform to criticize and insult a number of people and entities, including Rosie O'Donnell, Nordstrom's, Canada, the NFL, Puerto Rico, Robert DeNiro, the NSA, Mark Cuban, and Chicago. Shortly before Christmas, he decided to rip on the Federal Reserve (see below).


I will pass over the irony of Trump not being capable of understanding trade wars or a strong dollar. What I would like to cover is Trump's animus towards the Federal Reserve. Trump's tweet was in response to the Federal Reserve (the Fed) raising interest rates again. On December 19, the Fed raised the interest rate from 2.25% to 2.5%, resulting in the fourth interest rate hike this year.

When discussing interest rates here, we are referring to the federal funds rate, which is the rate at which "depository institutions, i.e., banks, lend reserve balances to other banks on an overnight basis." The federal funds rate is by far the most influential interest rate because it affects how individual consumers spend and save, as well as businesses.

On the one hand, raising the federal funds rate makes it more expensive to borrow money. This would mean that buying a home became more expensive (although selling one became more lucrative). It also makes it more expensive to pay off debt, which is disconcerting given the trajectory of government debt. On the other hand, raising the federal funds rate incentivizes saving. The Fed is looking at its dual mandate, which essentially to keep inflation at around 2 percent and unemployment at around the natural rate (estimated at 4.6 percent). Since inflation is projected to get higher and we are near full employment, the Fed wants to take its foot off the break because demand is growing faster than supply. The Fed's mentality is that it is better to ease up on the gas pedal than it is to overheat the economy and slam right into a recession. To better understand why the Fed would want to make borrowing more expensive, it would also help to explain the neutral interest rate.

Neutral Interest Rate
As these primers from the Brookings Institution and the 
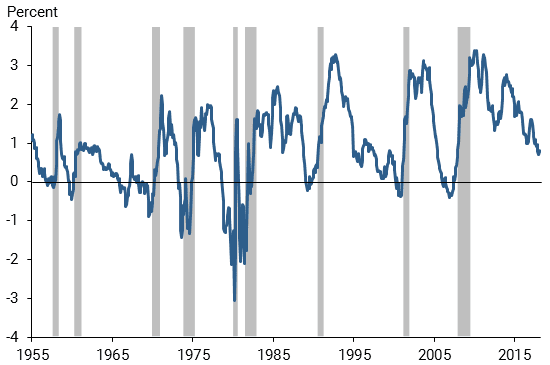
Dallas Federal Reserve explain, a neutral interest rate is the estimated rate in which investment in the economy is equal to the amount of capital or savings. This is the magic amount just high enough at which savers can save and just low enough where borrowers feel that borrowing money is not too expensive. The neutral interest rate is neither too accommodating nor too restrictive. Part of what makes this difficult to calculate is that the neutral interest rate is in fluctuation (see below). This dynamic rate takes into account multiple factors, including productivity growth, demographics (e.g., aging population), and fiscal stimulus (e.g., Roberts, 2018).


Reasons to Raise the Interest Rate
Some basic economic fundamentals dictate that we should raise the interest rate. Employment is really high. Normally, a lower interest is used to incentivize businesses to invest, thereby generating greater employment. Now that we are not in a recession, we do not need the easy money anymore. Plus, the GDP and wage growth have been growing in 2018, even amidst the interest rate increases.

There are some other wonderful benefits. Banks are more likely to lend money, which is good since lending practically came to a halt during the Great Recession. Getting off of quantitative easing also means that the stock market can react more to economic fundamentals and less to whether the Fed will perpetually support an expansionary monetary policy. It also means that bonds and bank accounts will have higher yields. A higher interest rate is also anticipated to lead to a stronger dollar, which is good if you're an American looking to invest internationally or travel abroad, a foreign company with American holdings, or a foreign company with exports because your exports are perceived as cheaper relative to American products. The reverse is true for foreign consumers, American producers, or American companies with lots of business abroad.

Another factor to consider is optics. The Fed maintains its reputation in part by maintaining its independence from the White House. If Trump is perceived to be pulling the strings of the Fed, it's bad for business, and ultimately, the global economy.

Reasons Not to Raise the Interest Rate
Raising the interest rate has some drawbacks. Consumers will have to pay more on their loans, which means less money for spending or saving. Given the lack of propensity to save in the U.S. in the past half century, a higher interest rate might not result in a higher savings rate. On the entrepreneurial level, it makes it more expensive for businesses to pay off debt, which means that businesses are less likely to make new investments. Debt servicing also has the potential to reduce employees' wages. Higher interest rates create issues with government debt and the increased cost of government borrowing. Those who are against raising the interest rate point out the fact that inflation has generally remained below the Fed's targeted 2%, and has declined in recent years. Based on this argument, there is not much need to raise the interest rates if inflation is this low. Matthew Yglesias also makes the argument that the economy might not be as strong as it seems, mainly because labor force participation is lower than the official unemployment rate signals.

Postscript
Adjusting the interest rate acts as a reminder that every form of public policy has its tradeoffs, including monetary policy (see tradeoff on a strong dollar here as an example). It is also a reminder of how elusive predicting the economic future can be, even for the experts. Current Fed estimates of the neutral rate are somewhere between 2.5% and 3.5% (see Fed figures here). This would mean that the current interest rate is at the low bound of the neutral rate estimate. Based on these estimates, we are now within range. I do worry about the pace at which the interest rates are increasing since too fast of an increase could cause some unintended reactions in the stock market or the housing market.

At the same time, these rate increases are increasing at more modest quarter of a percent. I do believe, much in accordance with the chairman of J.P. Morgan Chase International, that now is a good time to normalize the interest rate since the inflation rate is at the Fed's target, economic growth is good, and unemployment is low (also see Cato Institute policy brief about normalizing monetary policy). I don't have a crystal ball, but I would guess that given current economic strength (not to mention the stock market's recovery yesterday), the increase from 2.25% to 2.5% isn't going to be as dire to the U.S. economy as some suggest.

Monday, December 24, 2018

The Tax Cuts and Jobs Act: A Mixed Bag After Its One-Year Anniversary

A couple of days ago, we had the one-year anniversary of the Tax Cuts and Jobs Act (TCJA). This tax bill passed by the Republicans is the most significant tax reform passed in about thirty years. The types of reform ranged from permanent corporate tax cuts and temporary income tax cuts to repatriation, the mortgage interest deduction, and the child tax credit. I covered the topic twice already (see here and here), and I have to say that there was quite a bit to analyze. With all the speculation and postulating, how are we faring one year after the signing of the TCJA? It is difficult to determine the answer to this question, not only because of how encompassing the TCJA is, but also because it takes time for such reforms to fully take effect. Nevertheless, I made an attempt to answer the question.

A growing deficit. The single largest complaint I have about the TCJA is that it would balloon the deficit. The Joint Committee on Taxation estimated that it would increase the debt by $1.4T over the next decade, whereas the Congressional Budget Office estimated that it would be $1.9T. This would not be a surprising outcome since Congress cut taxes through the TCJA without addressing the spending increases. Without changing our course of action, we are looking at trillion-dollar-plus deficits for the foreseeable future, as well as an estimated 151 percent debt-to-GDP ratio by 2048.

Corporate tax cuts. The TCJA cut the statutory tax rate from 35 percent to 21 percent, which is a 40 percent decrease. Yes, it is true that the corporate tax cut decreased corporate tax receipts by 31 percent. But a report from the Journal of Economic Perspectives projects that the corporate tax cut is more likely to contribute to increased capital investment (Auerbach, 2018). To play Devil's advocate, the Economic Policy Institute shows that TCJA has not had significant increases in non-residential fixed investment and non-defense capital goods.

The red herring of "tax cuts the rich": the TCJA helped Americans experienced tax cuts on net. The Tax Foundation found that 80 percent of taxpayers had a tax cut, whereas 15 percent did not experience a tax increase or decrease. Every income bracket in every congressional district saw a net decrease in taxes. A report from Heritage Foundation not only confirms this finding, but also found that the average household will have $26,000 in extra wages over the next decade.

This is important because those on the Left like to bring up how the those in the top tax brackets received such breaks while the lower quintiles hardly received anything. As I explained in my TCJA analysis earlier this year, that is because the U.S. has a progressive tax code that disproportionately puts the burden on the top quintile and one in which 47 percent of Americans do not pay federal income taxes.

Tax Code Not Simplified: More Tax Breaks. One of the accomplishments that the TCJA was supposed to achieve is simplifying the tax code, as House Speaker Paul Ryan promised when he said that most Americans could fill out their taxes on a form of the size of a postcard. One metric for that is the number of tax breaks. Before the TCJA, there were 216 tax breaks. Now there are 223 tax breaks (Peterson Foundation).

Repatriation: Inconclusive. Prior to the TCJA, earnings from foreign subsidiaries were not subject to the U.S. tax code unless they were paid to the parent company in the form of a dividend. The prior tax code essentially created disincentives for multinational companies to store their earnings in foreign subsidiaries. The TCJA lowered the barrier by imposing a one-time tax of 15.5 percent on liquid assets and 8 percent on illiquid assets. This is an improvement because such assets were subject to the pre-TCJA corporate tax rate of 35 percent. The Tax Foundation found that repatriation has brought more $464.4B into the U.S. in the first six months of 2018, which is more than in 2015, 2016, and 2017 combined. However, the reason this remains inconclusive is because it is indeterminable as to how much is due to current earnings and how much due to past earnings. The Federal Reserve expressed similar ambiguities in its September 2018 report.

SALT Deduction and Interstate Migration. The TCJA doubled the SALT deduction, but put a cap of $10,000 on the deduction. This means that high-income taxpayers will face more of the brunt of state and local taxes. In September, the Cato Institute released a report on how the State and Local Tax (SALT) deduction affect interstate migration. In short, the SALT deduction reform has incentivized those in higher-tax states to move to lower-tax states.

Economic Growth. The Tax Foundation predicts that the corporate tax cut will result in increasing the GDP by 1.7 percent, the long-term capital stock by 4.8 percent, the wage rate by 1.5 percent, and employment by 339,000 jobs over the next decade. Accounting and tax firm Ernst and Young also has positive expectations for the TCJA. For the first five years, EY expects GDP growth to be 1.2 percent higher. As for the next five years, it will be at a more modest 0.8 percent. In the grander scheme of things, EY expects the long-run GDP growth to be 0.2 percent. The Dallas Federal Reserve had similar findings on its near-term GDP growth.

Conclusion: There are many other factors to consider, including the mortgage interest deduction, the territorial system, and the repeal of the individual mandate for Obamacare. Since there is so much to cover, what I would like to do is keep an eye on the TCJA and see what the longer-term effects are.

Friday, December 21, 2018

Bump Stock Ban: Not Just Bad Constitutional Law, But Also Low-Caliber Policy

Nearly 15 months ago, Las Vegas experienced the worst mass shooting committed by a single individual on American soil. The gunman murdered 58 people, as well as injuring over 800 people. The mass shooting brought up the discussion of mental illness linked to mass shootings. My analysis on the matter found that there is not a solid link between mass shootings and mental illness. The Las Vegas shooting brought up another topic in the gun debate: bump fire stocks. The bump fire stock, simply known as a bump stock, is a device attached to a semi-automatic rifle that allows for more than one shot to be fired when the trigger is pulled. Although the bump stock allows for mimicry of an automatic fire, it still requires multiple pulls of the trigger to have the desired effect. Essentially, it allows the semi-automatic rifle to act more like an automatic in terms of the amount of rounds one can fire in a minute. The gunman of the Las Vegas shooting used the bump stock to wreak havoc on those people.

Why am I bringing this up now? Because over a year after the shooting, the Trump administration's Alcohol, Tobacco, and Firearms (ATF) amended gun regulations to have guns with bump stocks categorized as "machine guns," and thus illegal. While President Trump issued a memorandum in February in response to the Parkland mass shooting to allow for such categorization, it took a few months to reach this moment. The point of amending these regulations is to show that the Trump administration is serious about curtailing gun violence.

There is a matter of constitutionality. The Cato Institute argues that the legislation should have been brought through Congress, not shoehorned into old pieces of legislation by executive agencies (also see National Review argument). There is also the argument that the Ninth and Tenth Amendment prohibit such legislation from being passed on the federal level, i.e., it should be done by state governments. Allowing for such a precedent would not only erode the separation of powers, but it could allow for semi-automatic rifles to be categorized as automatic rifles, as the American Enterprise Institute argues.

Let's forget the constitutionality argument for a moment. Even if it were constitutional, I would have a problem with it on a policy level. The National Rifle Association (NRA) was actually in favor of banning bump stocks, and I had to ask myself why. Some thought it as a step that the NRA was in support of "common sense" gun legislation. I will take the more cynical route and say that the NRA wanted to come off as less extremist as it does in the mainstream media by showing that it supports gun control. How so?

Prior to the Las Vegas shooting, the bump stock was considering something of a novelty. While it allows for a semi-automatic to de facto become more of an automatic rifle, the bump stock considerably sacrifices accuracy for a more rapid fire. The Las Vegas shooting was unique in that the shooter was 1,200 feet away and indiscriminately firing on a crowd with the sole purpose of maximizing damage. This would explain why I had such trouble finding empirical research on the effectiveness of a bump stock ban. Bump stocks had not been used in previous mass shootings, and have not been used since the Las Vegas shooting. Their lack of usage in homicides would explain why researchers would not bother analyzing the effects of such a ban.

This does not consider gun violence in the grander scheme of things. Rifles are not responsible for a majority of homicides. Quite the contrary! From 2013 to 2017, rifles only accounted for 1,582 homicides, which amount to 2.3 percent of all homicides (FBI Crime Statistics). The vast majority of homicides are committed by handguns, which would make a bump stock ban ineffective since bump stocks cannot be used for handguns. A bump stock ban would not affect nearly 98 percent of homicides. As for the other 2.3 percent, bump stocks are not used in homicides, as previously stated. Even the New York Times asked gun experts for their opinion on various gun control policy options, and their conclusion was that a bump stock ban would be ineffective (see chart below).


To recap, bump stocks have a high tradeoff between speed and accuracy. The vast majority of homicides are not committed by rifles. As unfortunate and tragic as the Las Vegas shooting was, the use of bump stocks for the purpose of homicide is an anomaly. It goes after a symptom rather than any of the root causes of gun violence. Therefore, there is no logical argument illustrating how a bump stock ban would be effective in reducing gun violence. Since most gun enthusiasts have little to no need for bump stocks, a bump stock ban is a low-hanging fruit for Democrats and Republicans alike. All a bump stock ban is going to do is create the illusion that the government is doing something about gun violence without actually doing anything.

Tuesday, December 18, 2018

Is There a Vaping Epidemic Among Teens?: The Policy Implications of E-Cigarettes for Teenagers

Ever since smoking electronic cigarettes, also known as "vaping," emerged on the scene, it became quite the controversial practice. Much of the debate surrounds harm reduction versus the precautionary principle. Are e-cigarettes a safer alternative for people? Should we be safe rather than sorry? I have analyzed e-cigarettes on this blog on a couple of occasions (see here and here). My conclusion was that the harm reduction principle is the more convincing of the arguments, that is to say that e-cigarettes are the less harmful (and thereby less evil) of the options. Allowing people a safer alternative to traditional cigarettes sounds like a win-win (maybe not for tobacco companies, but surely the consumers).

It might not be a win for everyone, especially teenagers. Only yesterday did the federal government issue a press release on its findings from its Monitoring the Future survey. One of the main findings is that teen e-cigarette usage increased from 11 percent in 2017 to 21 percent in 2018. This is significant because it is the largest year-to-year increase for any adolescent substance abuse outcome in the 43 years the survey has been conducted.

That might not sound so bad since e-cigarettes are less harmful than traditional cigarettes. However, combine that finding with an article that research organization Rand Corporation released yesterday on teen vaping. The article argues that for this sub-segment of e-cigarette consumers, e-cigarettes are more harmful because e-cigarettes lead to increased likelihood to smoke traditional cigarettes. The Rand Corporation cited a meta-analysis corroborating their theory (Soneji et al., 2017). From a public health standpoint, this is something serious to consider. When looking at e-cigarettes for adults, the idea is the adults go from consuming something more harmful to something less harmful. If e-cigarettes are indeed a gateway to traditional cigarettes, the introduction of e-cigarettes could be harmful to future adults.

In order to understand the trends with vaping, we need to understand the trends of traditional cigarettes, as well, because e-cigarettes and traditional cigarettes are substitute goods. This is important because the question is whether e-cigarette usage among teens causes an increase of tobacco consumption, a decrease, or has no real effect. According to the Centers for Disease Control and Prevention's (CDC) and its most recent survey data of tobacco use among middle and high school students, overall tobacco use for high school students has actually declined.


The CDC found that tobacco consumption was on the decline for middle school students, as well (see below).


How do we deal with the seemingly contradictory findings between the CDC and the Rand Corporation? Through an article in Tobacco Control that was co-authored by Georgetown University public health researcher David Levy (Levy et al., 2018). While e-cigarettes smoked by youth are associated with "an increased risk of ever using [traditional] cigarettes (smoking) and moderately associated with progressing to more established smoking," the report also found that "recent increases in vaping have been associated with declining rates of youth smoking."

In short, what the data tell us is that although the introduction of e-cigarettes makes it likely for some teenagers to smoke, the overall trend is that e-cigarettes reduce the probability that teenagers smoke tobacco products. Combine that with the fact that the British government found that e-cigarettes are 95 percent less harmful than traditional cigarettes, and the argument of e-cigarette opponents go up in smoke. I hope that people take a closer look at the data instead of demonizing a product that has the ability to save hundreds of lives.

Thursday, December 13, 2018

12-13-2018 Policy Digest: Gender Wage Gap, Social Security Privatization, Occupational Licensing

There is quite a bit of policy research that has come across my attention in the past few days. The bad news is that I cannot cover it all in the depth that I would like. The good news is that I have covered these topics in the past in some way, shape, or form, which means I can cover these topics more easily. With that being said, let's begin, shall we?

Gender Wage Gap: More Evidence It Is Misleading
Late last month, the Institute for Woman's Research put out some shocking research: the wage gap has been "woefully misstated." Their conclusion is that a woman makes 49¢ for every dollar a man makes. The reason why it looks worse has to do with how they're pulling and manipulating the data. To arrive to this conclusion, the Institute for Woman's Research compared all the earnings of women to all the earnings of men over a fifteen-year period, including part-time and unemployed workers. Unsurprisingly, four out of ten women were out of the workforce for at least a year, which is twice the rate of men being out of the workforce. Beforehand, the gender wage gap figure compared all male full-time workers to all female full-time workers. Including time with no income is naturally going to distort the statistical data to paint the picture that women are very underpaid.

You can see my analysis from February 2018 and April 2013 on the gender wage gap, but my contention has been that not using an apples-to-apples comparison is a manipulation of the data to advance a certain goal. The Institute for Woman's Research is merely the latest attempt to manipulate the data a step further. When you adjust the data for educational attainment, occupational choice, hours worked, and other forms of labor force attachment, the wage gap is all but nonexistent. Fortunately, a study from Harvard University adds to evidence to support my contention (Bolotnyy and Emanuel, 2018). The Harvard study looked at data on bus and train operators from the Massachusetts Bay Train Authority. Since the Authority is unionized, men and women do the same work for the same hourly wages and conditions, and promotions are based on seniority, and yet there was still a wage gap of 89¢. The reason for the gap? Men worked longer hours, and were paid more overtime. Plus, the women took off more time due to childrearing. Much like the study on the wage gap in the ride-sharing earlier this year, it focuses on one market, but it also adds to the increasing preponderance of evidence that the wage gap is not caused by gender discrimination, but by the different choices made by men and women.

Social Security Privatization
I thank former Cato Institute fellow Daniel Mitchell for bringing this one to my attention. The Organization for Economic Development and Cooperation (OECD) released the OECD Pensions Outlook 2018. In it, the OECD stated that "funded, private pensions may be expected to support broader economic growth and accelerate the development of local capital markets by creating a pool of pension savings that must be saved." Many OECD countries have partially or completely privatized its retirement savings (see below), including Australia, Denmark, Sweden, Singapore, the Netherlands, Chile, and Switzerland. I hope that the United States can have the good sense to privatize Social Security one of these days.


Occupational Licensing: Two New Studies
I have written about how occupational licensing creates barriers of entry to many markets, which disproportionately affects the poor. It also increases prices of goods and services since it is an additional cost of labor. How much does occupational licensing cost the economy? A study from the Institute for Justice found that occupational licensing costs the U.S. economy $200 billion annually  (Kleiner and Vorotnikov, 2018). A study from the National Bureau of Economic Research also reduces the equilibrium labor supply by anywhere from 17 to 27 percent (Blair and Chung, 2018).

Monday, December 10, 2018

Monopoly: Better As a Board Game Than Having Increased Corporate Monopolization In Real Life

As a child growing up, I remember playing the board game known as Monopoly. It would take hours to rack up all those properties before declaring a winner. Because it took so long, it ended up being one of those board games that one plays when it's raining out and it's one of the only things to do. I'm sure enough of you had similar experiences with Monopoly growing up. As I got older, I ended up spending some of my professional life conducting market research. One of the trends I realized is that multiple markets had high market concentration. What I mean by high market concentration is that very few market competitors (usually less than five) control most or all of the market share. When one company controls the entire market, the market becomes a monopoly. Under the Federal Trade Commission's definition, however, a company does not need to be a literal monopoly (read: pure monopoly) before it applies its rules towards single firm conduct.

Last Monday, the Open Markets Institute released an intriguing report entitled America's Concentration Crisis. OMI covered 32 markets in its report, ranging from home improvement stores and cell phone providers to pet supply stores, e-commerce, and beer. The report also covered the increased monopolization of domestic airlines, a topic that I covered separately last year. Shortly before the report was released, the New York Times released an article on the topic with a concise and damning chart (see below).


Some of you are probably wondering what could possibly be wrong with having monopolies. Some could argue that "bigger is better" in that they could offer the same good with less cost, thereby increasing the possibilities for consumers. I actually made that argument myself when discussing Big Banks in 2016. To tease out some nuance, there are some markets that do better with size. What we have to remember with banking is that a) it is a large market to begin with, and b) the market is not concentrated (see chart above).

With most markets, there are issues that come with too much market fragmentation. The same is also true for its inverse: too high of market concentration (e.g., Schmitz, 2016; Gumus, 2006von Mises, 1998Posner, 1974). Why? Looking at a basic economic model of a monopoly (see below), it creates deadweight loss. Deadweight loss is that allocative inefficiency when a good or service cannot be allocated at its most efficient, which is in a competitive market. This has to do with the fact that in a monopoly or a market with high concentration, a company has much more liberty to set prices, which means less of a good or service is produced. As a result, society as a whole is worse off. It is not solely a matter of decreased economic welfare. Fewer competitors in a market means that consumers have fewer places to buy goods and services. Not only do producers have less of an incentive to keep prices down, but they have greater incentive to keep quality low.


There is also a more prevailing theory on the Left that wage stagnation is caused by the employees' lower bargaining power due to market concentration. A recent paper from the Washington Center for Equitable Growth postulates that increased monopoly rents causes wages and interest rates to decline while the average rate of return on capital stays the same. I looked at the theory in August when analyzing wage growth stagnation. I thought the argument had some merit, although the research on monopsony power is relatively new. I can find myself agreeing with my Left-leaning friends on this increased power while disagreeing with the underlying causes (e.g., government intervention in protecting certain companies over others, also known as "rent-seeking") or the solutions (e.g., should we toughen our antitrust laws?). I don't expect those discussions to be resolved anytime soon. What I can say is that monopoly is better as a board game than it is played out as an economic reality.

Thursday, December 6, 2018

The Yield Curve Inverted: Does That Mean a Recession Is Coming to the United States?

This week has not been good for investors on Wall Street. It is not simply a matter of the Dow dropping 800 points on Tuesday. On Tuesday, it was also announced that the yield curve between two-year Treasury bonds and five-year Treasury bonds inverted. Hearing the words "inverted yield curve" can be quite scary for investors, but for everyone else, it might mean little or nothing. What has investors so frightened?

First, a brief explanation of an interest rate. The interest rate is the amount, either in percentage or dollar amount, charged by a lender to a borrower for the use of their assets. Essentially, it is the cost of borrowing money. There are multiple factors that go into account for the interest rate, whether that be for a loan on a house, on stocks, and on bonds. One of the factors is that of time, and this is where the yield curve comes in. Typically, a ten-year Treasury bond has a higher interest rate than a two-year Treasury bond to compensate the lender for the time difference. The difference between the two interest rates is referred to as the "spread." A positive spread means that the interest rate for the ten-year bond is higher than that of the two-year bond. The normal spread will take the shape of an upward-sloping yield curve, as is depicted below.


That is what happens with a normal yield curve. That is not always the case. Sometimes, there are moments when the short-term bonds have higher interest rates than long-term bonds. This moment is referred to as an inverted yield curve. What an environment with a negative spread would mean is less profitability for banks. While you might not necessarily care about banks or the U.S. Treasury, this has investors spooked. 

Likelihood of a Recession
This is particularly irksome for investors because an inverted yield curve is related towards higher risk of a recession. How much higher exactly? A 2018 economic paper from the Federal Reserve Bank of San Francisco (FRBSF) points out a scary fact: every recession in the past 60 years was preceded by an inverted yield curve. This trend is not only true in the United States, but in other developed nations. The FRBSF goes as far as calling the yield curve "one of the most reliable predictors of future economic activity."


There are a couple of things worth noting. The first is that FRBSF found that the recessions take place six to twenty-four months after the yield curve inverts. Assuming 100 percent accuracy, that means we could have until the end of 2020 before the United States experiences a recession. The Federal Reserve Bank of Cleveland (FRBC) indicates in its analysis that there were two false positives: one inversion in late 1966 and one flat yield curve in late 1998. This would imply that treating the yield curve as infallible is not accurate.

The FRBC is also hesitant on using the yield curve as a predictor for two reasons. The first is that the probability itself is subject to error. The second is that yield curves do not function in the same way as they did in the past, and that is due to different underlying determinants. For example, yield curves have historically been brought on by tight monetary policy. Right now, we have lower interest rates than the historic average, so that case is hard to make. The quantitative easing has distorted the long end of the yield curve. To adjust for it, the Federal Reserve came up with the alternative measurement of the "near-term forward spread," which seems to have better predictive power. Fortunately, this spread has not indicated a recession as of yet. Also, the spread between three-month and ten-year bonds is a more accurate predictor than with the two-year-bonds, and fortunately, there has not been an inversion between three-month and ten-year bonds.

Conclusion
Historic data suggest that a recession is coming soon. Even if we were to set aside the yield curve, we could be worried about contagion from Italy's budgetary woes or the Brexit. We could be worried about Trump's trade policy or the Fed's monetary policy. On the other hand, there are multiple positive economic indicators, including GDP growth, low unemployment, and high consumer confidence. We could fret over the fact we're in the longest bull market in history by saying "we're due for another recession" or we could learn how to keep the bull market going for even longer. I do worry about a recession because a) economies have booms and busts, and b) we have indicators in the global economy that could derail the bull market. At the same time, I am not quite ready to say that this yield curve inversion signals an imminent recession. Even the Federal Reserve of New York predicts an 11 percent chance of a recession in the next year. At this juncture, I will take a "wait and let's see" approach to see what happens within the next year.

Monday, December 3, 2018

What Does White House's Climate Change Report Say About Climate Change Urgency?

Global warming, better known as climate change, has been at the forefront of environmentalists' minds for quite a few years now. The premise is that the planet's overall temperature will rise to the point of causing significant weather changes, which will impact agriculture, migration, economy, and a host of other issues. During Thanksgiving weekend, the U.S. government quietly released its Fourth National Climate Assessment. Looking at the news reports covering this, it confirms the extent to which anthropogenic climate change will end up being problematic down the road. In his bellicose fashion, President Trump denied the findings. Even so, the major news is that a report from the Trump administration, an administration that hasn't exactly been open to increased environmental regulations.

When looking at the report, there are some dire predictions, and that is just looking through the summary findings of the report. The Midwest could lose 25 percent of its production capacity for corn and soybeans. Ocean acidification will limit access to seafood. Pollen seasons will intensify. More extreme weather will cause depression, anxiety, and suicidality. Poor air quality and higher temperatures will result in more premature deaths. Labor-hours will be lost, thereby reducing economic output. There are more adverse effects, but the point that the report is making is that climate change is man-made, and it will wreak havoc on the United States.

A Dose of Skepticism
I wouldn't be doing my job if I were not at least a tad skeptical of this report. A good amount of this skepticism comes from the report's projected changes in climate (see below). There are three scenarios: the higher scenario (RCP8.5), the lower scenario (RCP4.5), and the even lower scenario (RCP2.6). In two out of the three scenarios, the temperatures would not rise to the 2C˚ post-Industrial revolution, the temperature in which climate scientists worry about cataclysmic events.
To be fair, this chart alone does not state the projected probability that each scenario is to occur. The report tries to answer this question, but provides an ambiguous answer (Box 2.4). On the one hand, emissions from the late 1990s up to the early 2010s suggest the higher scenario. On the other hand, since 2014, economic growth has been less carbon-intensive, thereby suggesting the lower scenario. The preliminary data for 2017 suggest a trend towards the higher scenario, but what matters here is that even the report is not certain about which scenario will play out.

There is further reason to be skeptical of the higher scenario beyond the report's ambiguity. The higher scenario is that: a worst-case scenario (e.g., Riahi et al., 2011, van Vuuren et al., 2011). It assumes that population growth is going to be high, technology development is going to be stagnant at a rate below historical averages, there will be a massive increase in poverty (which would be a major reversal of what has happened since the Industrial Revolution), coal consumption will increase 900 percent, and that GDP growth will be slow. As the Institute of Energy Research points out in its analysis of the White House report, the RCP8.5 model injects more pessimism beyond a lack of government action. I have expressed skepticism about implementing policy based on worst-case scenarios before, and given the findings from a 2017 article in Science (Hsiang et al., 2017), I have to wonder (see below).


Conclusion
It is not simply the issues with the climate change modeling or using an extreme scenario as the sole basis for the analysis. It also goes beyond ignoring certain climatological trends, such as as tornado occurrences plateauing since 1954, a more longitudinal look at global temperatures, a lack of trend for droughts and wildfires, or Arctic and Antarctic sea ice fluctuations (see American Enterprise Institute analysis here for more). There is also an issue of providing an accurate cost-benefit analysis. The report gets into the cost of inaction (Chapter 29), but does not specify the costs of action. Providing a cost-benefit analysis means getting the cost and benefits of all options, not just some. I am not here to say we should do nothing because I have made the argument for a modest carbon tax, as well as investing in research and development to lower carbon emissions. At the same time, the climate change we implement should a) have costs that are lower than the cost of climate change itself, b) mitigate the negative effects of climate change on standard of living, and c) be based on realistic projections, not implausible ones. Anything less would be doing a disservice in the world of environmental policy.